
| Theme: Medical Physics | |||
 |
||||||
| DVH Analysis using a transmission detector and a model-based dose verification system as a comprehensive QA tool for VMAT plans |
 |
|||||
|
||||||

A radical advancement of radiotherapy treatment planning strategies combined with innovative imaging and delivery systems with varying degrees of freedom enables high doses with steep dose gradients to be administered to the target while preserving normal tissue [1]. Volumetric modulated arc therapy (VMAT) and stereotactic body radiotherapy (SBRT) techniques are routinely used in clinical practice to treat complex targets in various treatment sites [2, 3].
To verify the dose calculation generated in the treatment planning system (TPS) and delivery system such as linear accelerator, each treatment plan created using complex techniques requires a comprehensive patient-specific pretreatment quality assurance (QA) process. Pretreatment QA methods based on radiochromic films, ionization chamber or scintillation detectors, portal dosimetry, Monte Carlo and log file analysis have been published and proved useful for patient-specific pretreatment QA but each approach has its own limitations as well.
Conventional pre-treatment QA includes delivering the patient plan to a standard phantom and comparing the measured and calculated 3D dose distribution using gamma analysis with different passing criteria. While gamma analysis based on measurements using different detectors provides a valuable understanding of whether the linear accelerator is operating as planned, it doesn't provide any correlation indicating a decrease in clinical metric with increasing and decreasing passing rate nor predict the clinical impact.
To overcome these limitations, the incorporation of dose volume histogram (DVH) information within the QA procedure, in addition to gamma passing rates, is required to provide a comprehensive patient-specific pre-treatment QA. This would offer an insight into the relevance of observed differences between measured and the TPS planned dose to the target and surrounding normal structures.
 Treatment Planning and Delivery
In this prospective study, seventy-three subsequent VMAT clinical treatment plans treated between November 2018 and April 2019 were selected for evaluation. The cases were categorized into four clinical sites: Head and Neck (n = 19), Thorax (n = 16), Abdomen (n = 17) and Pelvis (n = 22). All treatment plans were generated using Monaco v5.11 (Elekta AB, Sweden) TPS based on Monte Carlo dose calculation algorithm and a nominal acceleration potential of 6MV was used. All plans were delivered on an Infinity® (Elekta, Stockholm, Sweden) linear accelerator equipped with Agility™ multi-leaf collimators (MLC).
Dose Objective and Constraints
The individual plan was generated to achieve better dose conformity with steep dose gradients and good target coverage while maintaining the constraints to critical organs as recommended in QUANTEC and RTOG protocols. All plans were accepted and clinically approved for treatment by a Consultant Physician.
Compass Verification System
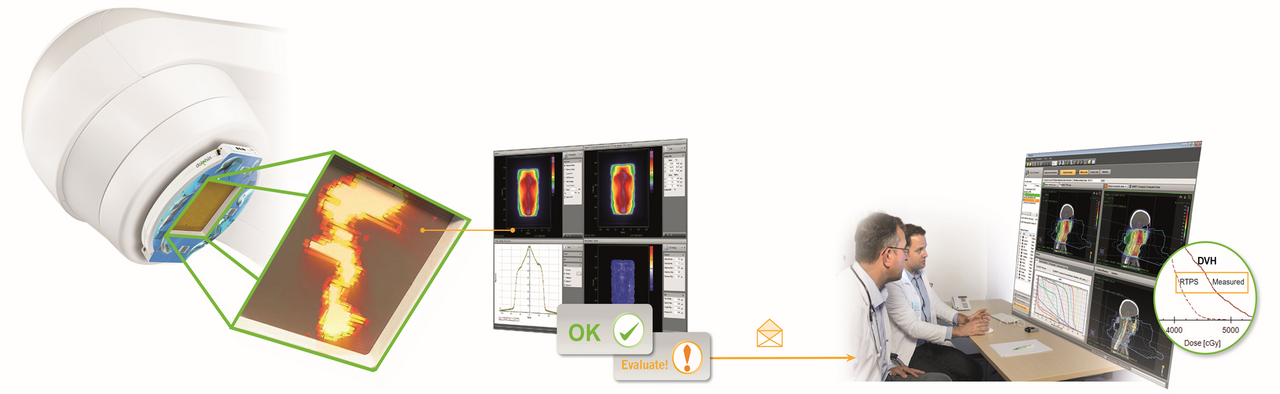
COMPASS verification system v4.1 (IBA Dosimetry, Schwarzenbruck, Germany) is an integrated software solution comprising a dedicated beam model and a virtual accelerator that was created with the photon beam commissioning data of the institutional linear accelerator.The dose engine implemented in COMPASS uses a collapsed cone convolution/superposition (CC) algorithm
Dolphin Transmission Detector
Dolphin transmission detector array (IBA Dosimetry, Schwarzenbruck, Germany) consists of a pixel-segmented ionization chamber that is a 2D array of 1513 air-vented plane-parallel chambers that are arranged in a square plane with an active area of 240 * 240mm2. The Dolphin transmission detector is mounted at the gantry at a source to surface distance (SSD) of 600mm. The size of each air-vented chamber is 3.2mm in diameter and 2mm in height. The spacing of the detector is 5mm for a field size of up to 140 * 140mm2 which projects to approximately 8mm in isocenter distance when the source-to-detector distance is 600mm, whereas 5 to 10mm in the remaining area.
A conventional global gamma analysis was performed for all cases by normalizing both calculated and measured to the maximum absolute dose from TPS. A distance to agreement (DTA) of 3mm and dose difference of 3% with a 10% lower dose limit threshold was applied for all cases to exclude the clinically irrelevant dose levels. A passing percentage of 95% with gamma values ≤ 1 were applied for all cases.
For independent model-based TPS verification, the dose calculation generated in TPS was compared to dose computed (DC) by Compass verification system using the CC algorithm. Secondly, for measurement based pre-treatment QA, TPS calculated dose was compared to reconstructed dose (RD) generated directly on patient anatomy based on fluence measurement using Dolphin transmission detector.
The DVH based indices: the average dose (Dmean) and dose received by 1% (D1) of the target volumes and OARs for all cases calculated using TPS was compared to Compass dose computation (DC) and reconstructed doses (RD).
Further, the correlation between gamma pass rate (3% 3mm criteria) and mean difference, attained between planned and measured dose, using DVH analysis for PTVs was studied. The Pearson correlation coefficient was used to calculate the correlation between calculated and measured dose distribution. Furthermore, TPS achieved dose constraints for OARs in each case were compared to the reconstructed dose measured using the Dolphin detector with the Compass verification system.
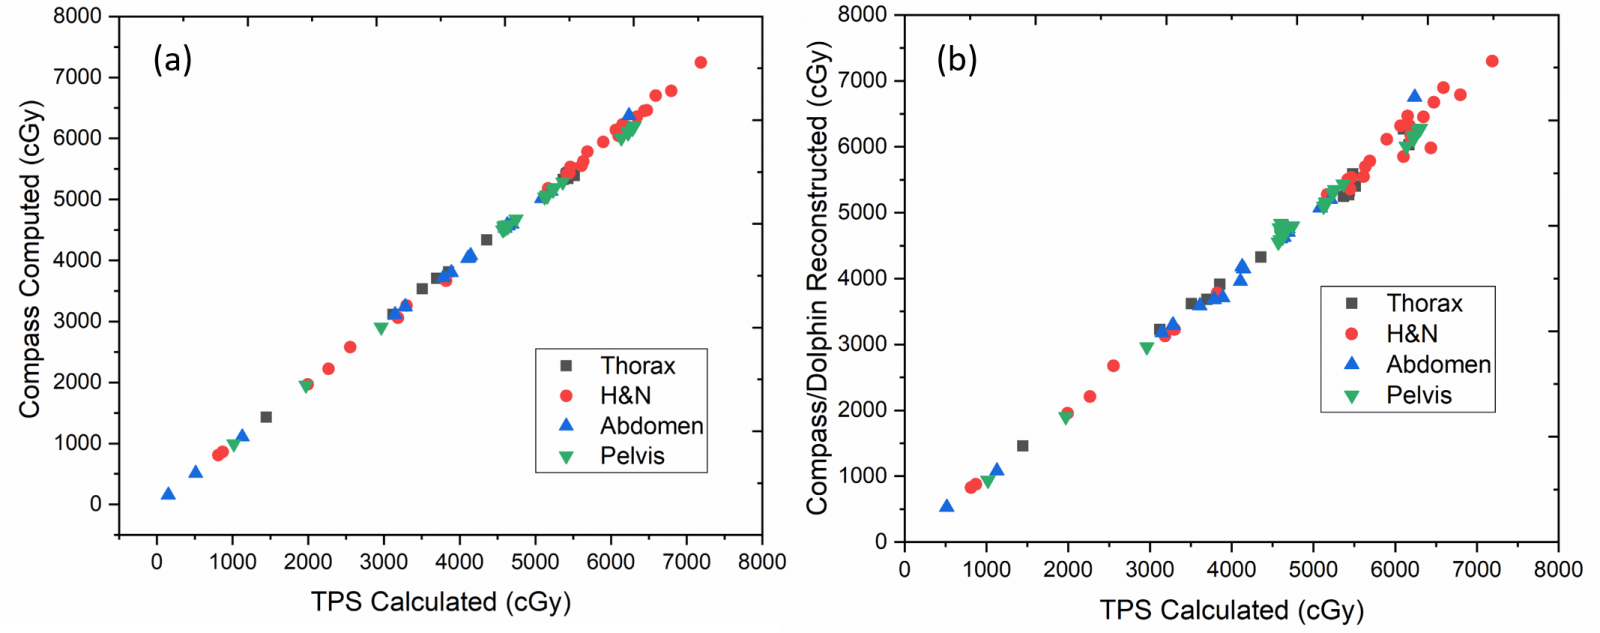
The mean planned dose (Dmean and D1) using the Monte Carlo algorithm, for target volumes (PTVs) and OARs for all cases, resulted in good agreement with Compass computed dose calculated using CC algorithm (r2=1). This ensured an independent dose verification of TPS calculation.
A good correlation was observed between TPS planned dose (mean) and compass reconstructed dose (using Dolphin detector) for target volumes. Figure 1 illustrates the comparison of measured and calculated dose to PTVs for all cases. A marginally reduced PTV coverage was observed for Head and Neck cases from the reconstructed doses to those planned in TPS (r2=0.98). Likewise, the reconstructed dose for individual OARs correlated well with TPS planned dose for all sites except small structure in head and neck cases and heart in thorax.
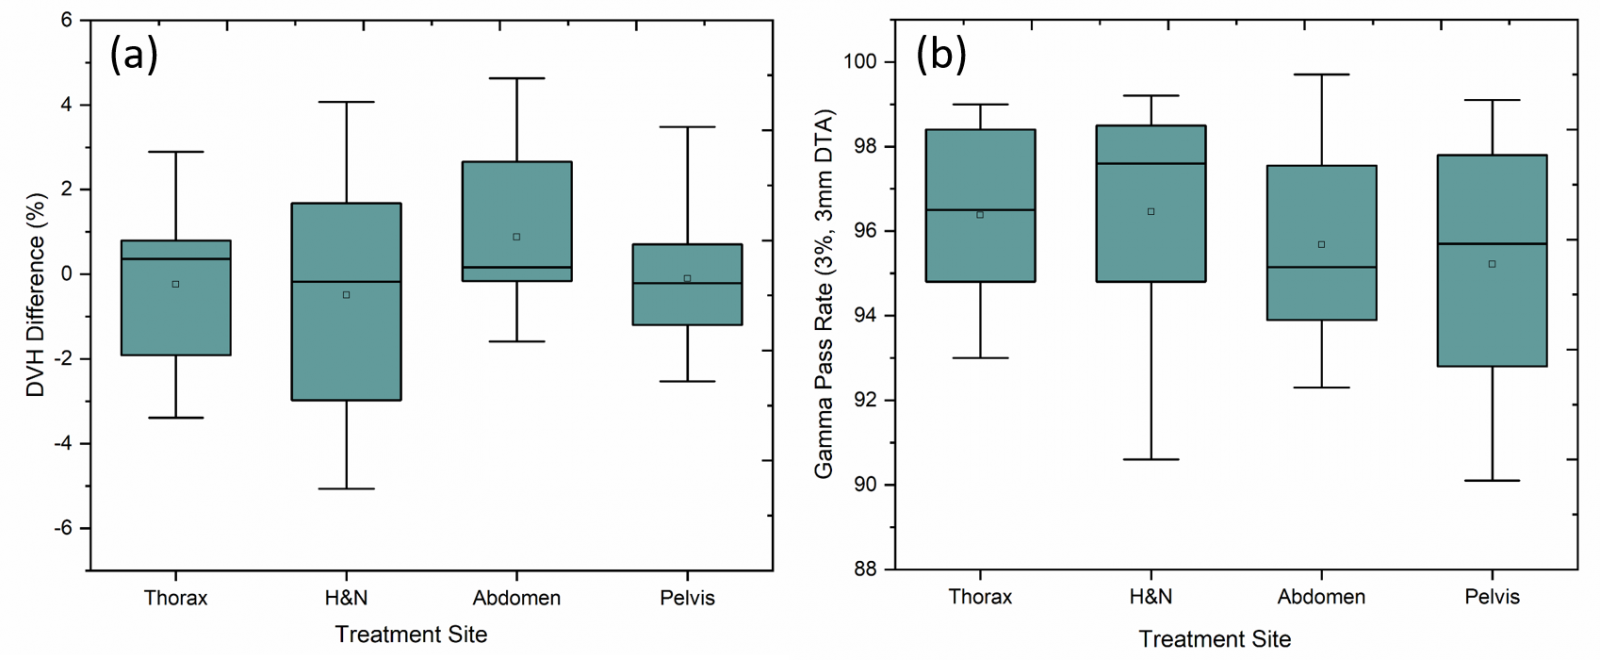
The average percentage difference between TPS calculated and reconstructed dose for PTVs (Dmean and D1) achieved using DVH analysis for each site is as follows: Head and Neck – 0.57% ± 2.8 (Dmean) & 2.6% ± 2.7 (D1), Abdomen – 0.19% ± 2.8 & 1.64% ± 2.2, Thorax – 0.24% ± 2.1 & 3.12% ± 2.8, Pelvis 0.37% ± 2.4 & 1.16% ± 2.3 respectively. Figure 2 illustrates the gamma passing rates using 3% / 3mm criteria and the DVH percentage difference for PTVs between TPS calculated and reconstructed dose distribution. The average percentage of passed gamma values achieved was above 95% for all cases (Head and Neck – 96.5% ± 2.6, Abdomen – 95.68% ± 2.6, Thorax – 96.4% ± 2.4, Pelvis 95.2% ± 2.4). However, no correlation was observed between gamma passing rates and DVH difference (%) for the target volumes (r2=0.11).
DVH analysis of complex treatments plan using a model-based verification system (Compass) and Dolphin transmission detector provided useful information on clinical relevance for all cases and could be used as a comprehensive pre-treatment patient-specific QA tool.
- Thoelking J, Fleckenstein J, Sekar Y, et al. Patient-specific online dose verification based on transmission detector measurements. Radiother Oncol. 2016;119(2):351-356
- Boggula R, Jahnke L, Wertz H, Lohr F, Wenz F. Patient-specific 3D pretreatment and potential 3D online dose verification of Monte Carlo-calculated IMRT prostate treatment plans. Int J Radiat Oncol Biol Phys. 2011;81(4):1168-1175.
- Tamborra P, Martinucci E, Massafra R, et al. The 3D isodose structure-based method for clinical dose distributions comparison in pretreatment patient-QA [published online ahead of print 2018/11/20]. Med Phys. 2019;46(2):426-436.
 Send Email