
| Theme: Biomedical Engineering | |||
 |
||||||
| Microwave Imaging System Using Ultra-Wideband Antenna for Intracerebral Hemorrhagic Stroke Detection |
 |
|||||
|
||||||
The microwave imaging system using ultra-wideband antenna is expected to complement the current imaging modalities for detecting the intracerebral hemorrhage stroke.
Stroke
Stroke is the second leading global cause of death behind ischemic heart disease [1]. It is a cerebrovascular disorder that results from a damage of a brain tissue [2]. The damage can be caused by either a clot in the arteries and called Ischemic stroke, or by a rupture with the name of Hemorrhagic stroke [3].
Depending on the location inside the skull, four different types of hemorrhages are defined [3]. Intracerebral hemorrhage (ICH) is considered as the most common type of hemorrhagic stroke, which is located inside the pia matter, the third meninges of the brain [4].
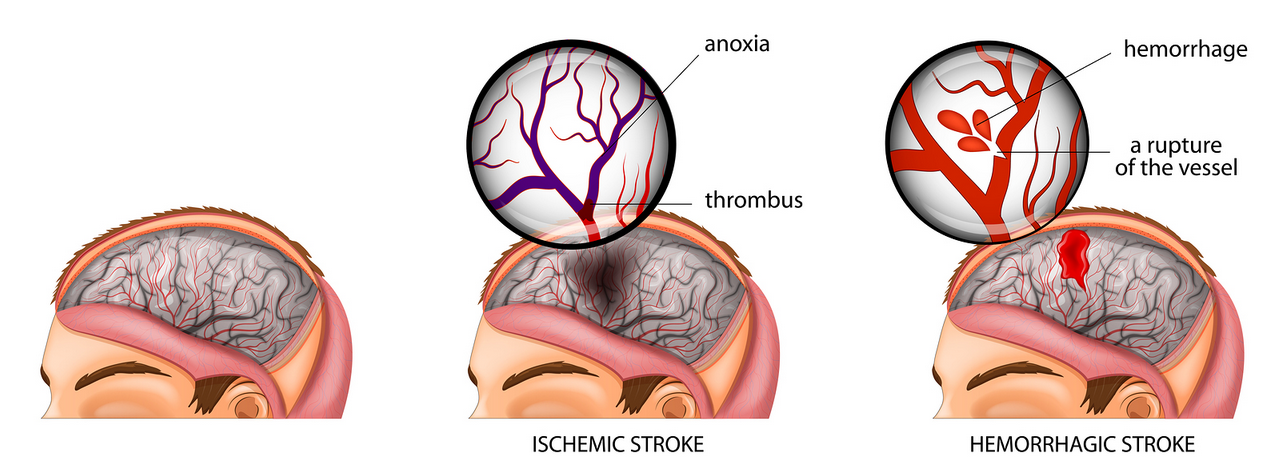
Figure 1: Types of Stroke [5].
Stroke Diagnoses
Imaging applications are mandatory for diagnosing stroke, since it is non-invasive and provide much valuable information [6]. Currently, computed tomography (CT) and magnetic resonance imaging (MRI) modalities are common to use for the stroke diagnosis [7]. Moreover, in recent years the researchers showed that microwave radiations can be used for medical imaging to diagnose the stroke. Table 1 compares between Microwave Imaging System (MIS) and the current modalities.
Table 1: Comparison between Microwave Imaging System and the Current Modalities [8], [9], [10],[11], [12], [13], [14], [15], [16],[17].
|
|
Conventional MRI |
Conventional CT |
Microwave imaging |
|
Radiation |
Non-ionizing (+) |
Ionizing (-) |
Non-ionizing (+) |
|
Mobility |
Immobile (-) |
Mobile (+) |
Mobile (+) |
|
Cost |
Extremely expensive (-) |
Expensive |
Cost effective (+) |
|
Sensitivity |
Insensitive to identify acute hemorrhagic (less than 24 hours) (-) |
Insensitive to identify ischemia in earlier stage (-) |
Sensitive to detect hemorrhagic and ischemic stroke (+) |
|
Processing time |
Up to 45 minutes (-) |
Complete within 5-10 minutes (+) |
Depends on signal processing time |
|
Spatial resolution |
1 mm or less |
0.35 mm (+) |
Frequency dependent (could be 0.5 mm) |
(+): advantage (-): disadvantage
Ultra-wideband Antennas
An antenna is the main part of any radio-frequency (RF) system, which is responsible to transmit and receive the signals [18]. Antenna converts the electrical signals whether a voltage or current into an electromagnetic (EM) wave and vice versa [19]. Recently, Ultra-wideband (UWB) antenna has received a significant interest to be used as a medical diagnostic tool, especially for stroke detection. The low power consumption, low cost for implementation and high data rate are the main advantages of the UWB radar system [20].
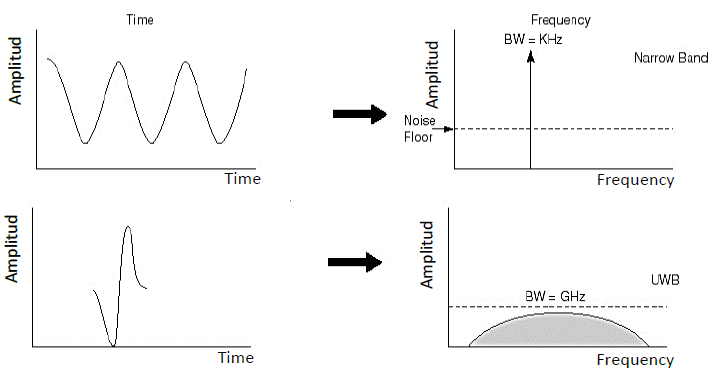
Figure 2: Narrowband versus UWB in time and frequency domain [21].
Principle of microwaves
Microwave refers to the electromagnetic signal waveform associated with radio and radar technologies [22]. It uses the scattering signals to identify the presence of the target. Therefore, it identifies the exact location and infers the characteristics [23]. Biological tissues are imaged based on the differences in their dielectric properties [24]. The most important dielectric properties for microwave imaging are the permittivity (ɛ) and the conductivity (σ) of the target, and they are a function of frequency [25]. Microwave imaging mainly depends on a band of operating frequencies. So, the relation between the resolution and penetration can be a trade-off process [26]. Previous studies showed that between 1 GHz and 4 GHz, a brain image with good penetration and resolution can be achieved [27]. For microwave imaging, the range from 3.1 to 10.6 GHz is approved by Federal Communications Commission (FCC), and it covers the area of interest for brain imaging [28].
Introduction
This poster summarizes the process of designing a microwave imaging system for ICH stroke detection in simulation environment using Computer Simulation Technology software (CST). This system is operating in the frequency range from 3.1 to 4 GHz. The system selected to work using ultra-wideband printed circular monopole antenna (UWB-PCMA). The UWB was chosen because of its suitability for the modern radar system. The expected design of the system to test the validity of the simulation results is represented in the following schematic diagram.
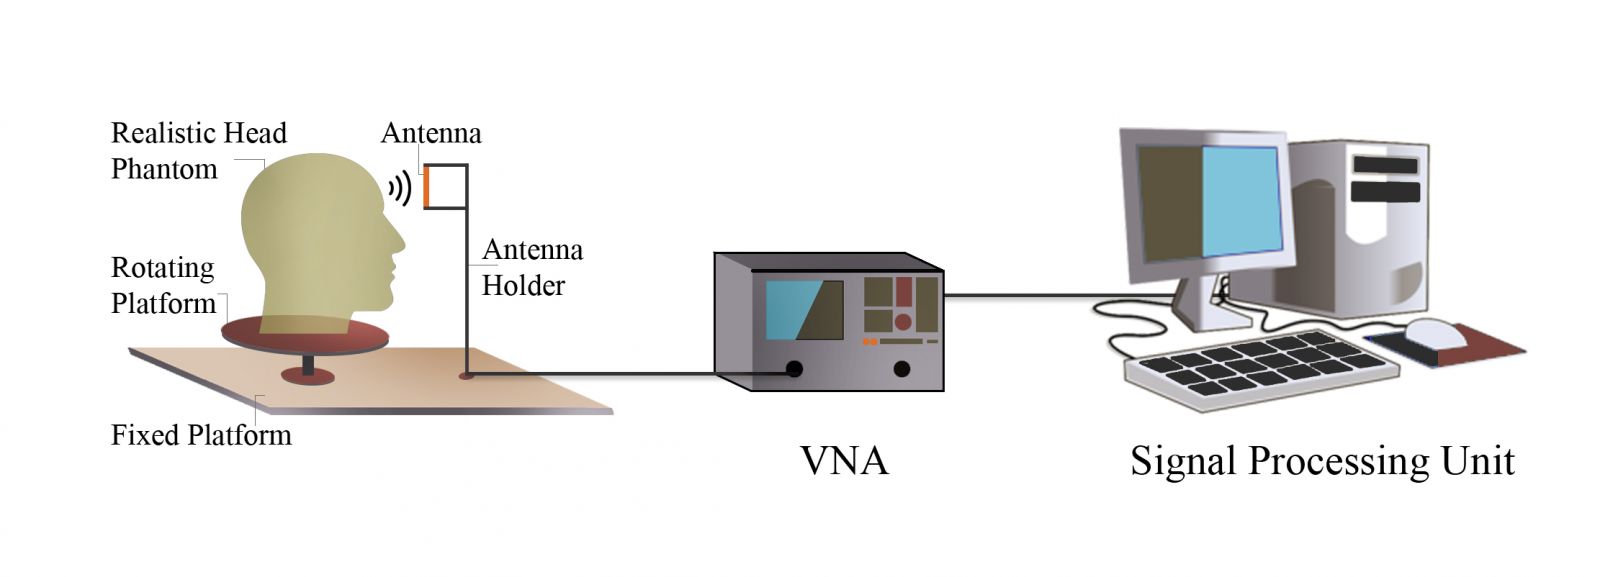
Figure 3: Initial representation of the MIS.
Safety Concerns of Exposure to Microwave Energy
Since this system interacts directly with the human body, it is important to consider its safety. A safety regulation was set by the FCC regarding the amount of energy allowed to be absorbed by the biological tissues. Specific absorption rate (SAR) measures the amount of the power dissipated in a unit of a tissue mass. For the range of frequencies between 100 KHz to 10 GHz, FCC has set a limit of the allowed exposure to be 1.6 W/kg in average over 1g of tissue. SAR can be calculated using the following formula [27].
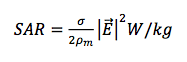
where  is a tissue density,
 ,
, is a tissue conductivity,
 , and
, and  is the electric field,
  .
.
Moreover, SAR can be measured using CST® MWS. To test the safety of the system, the values of SAR for head tissues must be within the limit which set by FCC.
Antenna Design
The design of PCMA requires calculating certain parameters that are shown in Figure 4 [29]. To design a compact PCMA, the substrate material selected to be TMM® 10 Laminates (lossy). The parameters have been calculated and been utilized to design the antenna on CST® MWS module. The final dimensions of the antenna are shown in Figure 5. To evaluate the performance of the antenna, graphs of S-parameters and far field has been established and analyzed.
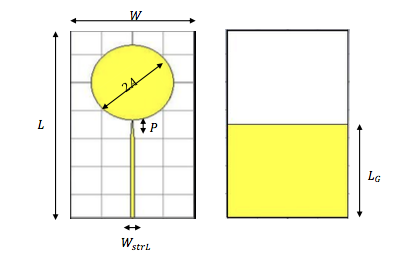
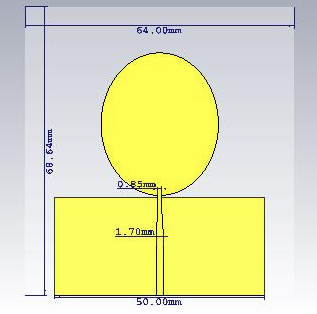
Figure 4: PCMA Parameters. Figure 5: Antenna Dimensions.
A reflection coefficient of -10 dB and less is desired to cover the entire operating bandwidth. The graph of S11 parameter in Figure 6 shows that the reflection coefficient for the entire band from 3.1-4 GHz to be less than -10 dB. It indicates that more than 10% of the power fed to the antenna have been reflected. Since the impedance values are expected to oscillate around 50Ω, the Z- Matrix graph has been displayed to validate the result. As shown in Figure 7, the impedance is oscillating around 50Ω, which gives a satisfactory performance for the antenna and its detection of the surrounded objects.
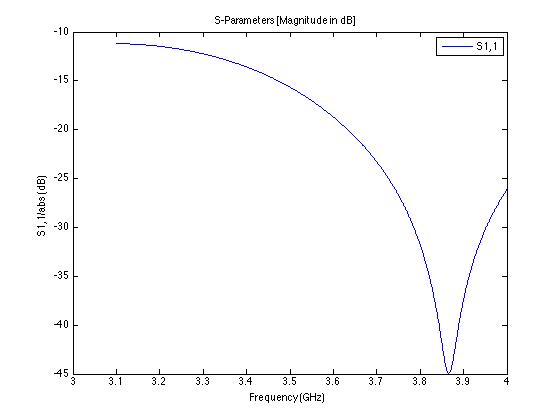
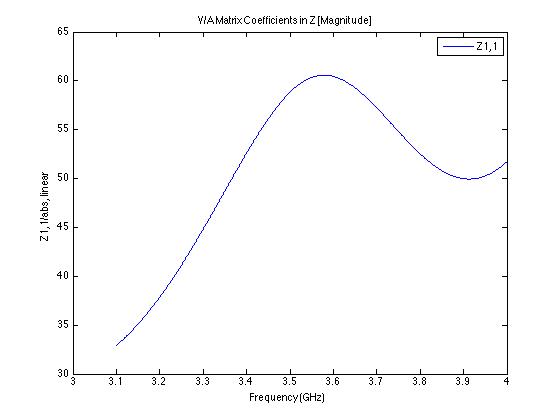
Figure 6: S11 Parameter of the PCMA Design. Figure 7: Z-Matrix of the PCMA Design.
Phantom design
A slice of a realistic head model has been designed in CST® microwave studio software to be used with the aim of testing the detection capability of the antenna. The model was designed to be similar to the human head tissues in terms of permittivity and conductivity for the four layers of the brain which are Skull, Cerebro Spinal Fluid (CSF), Gray matter, and White matter. Also, a hemorrhagic target has been inserted at different locations inside the phantom. The hemorrhagic target has a spherical shape with diameter of 5 and 7.5 mm. Moreover, its electrical properties been the same as blood. The electrical properties of each tissue of the head in the frequency range 3.1-4 GHz have been determined according to Cole-Cole model [30]. The following figures show the designed phantom and the dimensions have been used.
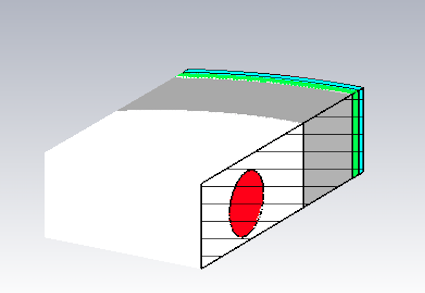
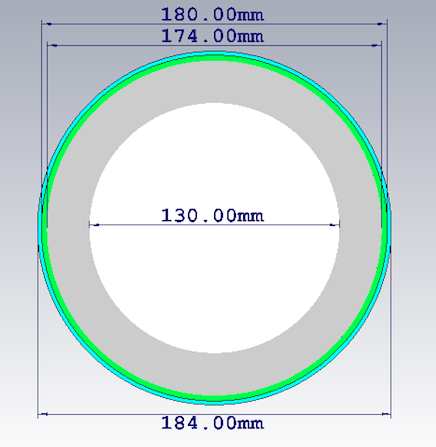
Figure 8: Cross Section of the Phantom. Figure 9: Phantom Dimensions.
Simulation
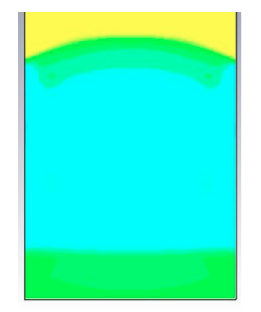
The designed phantom has been placed in front of the PMCA in the far-field region, which starts at 73.67 mm away from the antenna. Testing was done by locating a spherical target with 7.5mm radius inside the white matter. Figures 10(a) and 10(b) show the electric field distribution at frequency 3.7 GHz. It was observed at two different situations, with and without the target. The electric field in both cases was set to 0-270 V/m.
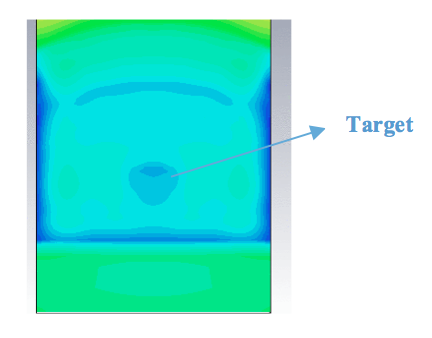
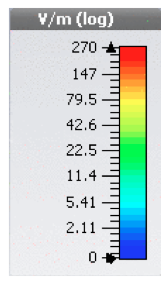 (a) Without Target (b) With 7.5 mm Target (c) Simulation color bar.
Figure 10: Electric Field Distribution of the Phantom with a Target of 7.5 mm Radius.
As shown in the previous figure, the electric field value of the target appears lower than the electric field value of the white matter. The lower electric field value of the target is a result of increasing in the absorption, which is represented by the high conductivity of the target. Table 2 presents the dielectric properties for the target and the white matter.
Table 2: Permittivity (ε) and Conductivity (σ) for the Target and White Matter at 3.7 GHz.
|
Tissue |
Permittivity (ε) |
Conductivity (σ) |
|
Blood (Target) |
56.184662 |
3.788131 |
|
White Matter |
34.791779 |
1.937493 |
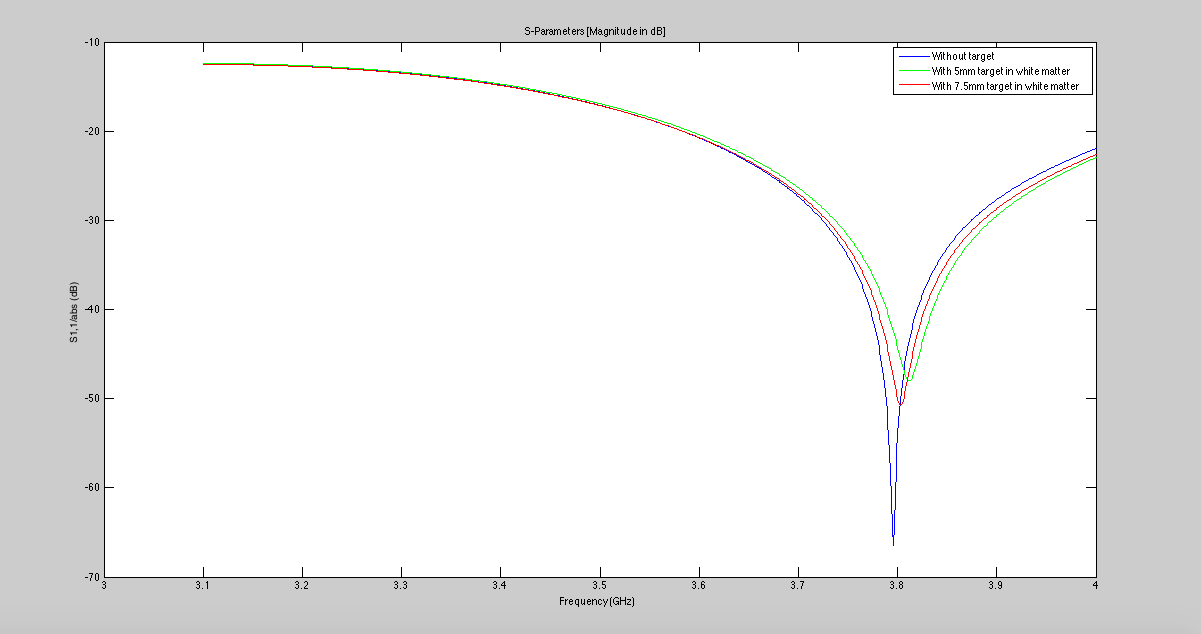
Figure 11: Reflection Coefficient for The Phantom in Different Conditions.
Figure 11 displays the reflection coefficient for three different cases. First case represented by a blue line, is the phantom without target where the value of S11 almost -70 dB. The second case represented by a green line, is the phantom with a target of 5mm radius located inside the white matter with S11 value of -50 dB. The third case represented by a red line, is the phantom with a target of 7.5mm radius located inside the white matter with S11 value of -47 dB. According to Table 2, the target has a higher permittivity value compared to the white matter. And by observing the above figure, it shows that the phantom with the target has a higher reflection from the case with the phantom only.
In summary, the above results prove that the designed antenna is able to detect the hemorrhage target inside the brain down to 5 mm radius.
Future Work
- Signal Processing
This stage requires using programming software such as MATLAB® to process and construct the image. The signal will be processed and analyzed using an algorithmic code, which leads the image to be formed.
- Fabricating the Antenna
For this project, a low-profile antenna can be printed on a dielectric substrate using PCB prototyping machine.
- Fabricating the Phantom
To test the fabricated antenna in real conditions, a phantom mimicking real human head is needed. The phantom should mainly focus on having the same dielectric properties as the human head [30]. The skull can be fabricated using 3D printer. Every part of the brain is fabricated using a mixture of chemical materials with different ratio.
The results from the simulation and the experimental testing will be compared and analyzed.
- MIS as a product
The complete system can be constructed as a product to be used in emergency and primary health facilities. The product may consist of an array of antennas placed in a rotational ring, which represents the gantry. The width of the inner ring of the gantry should be enough for the patient's bed to pass through it. It can stand vertically with wheels under it, allowing the movement of MIS. The microwave signal will be generated by microwave transceiver. Moreover, the processing unit for the image reconstruction will be attached to the gantry. The image will be displayed on a monitor connected to the MIS, so the physician can assist the patient condition. Figures 12 represents the expected construction of MIS system as a product.
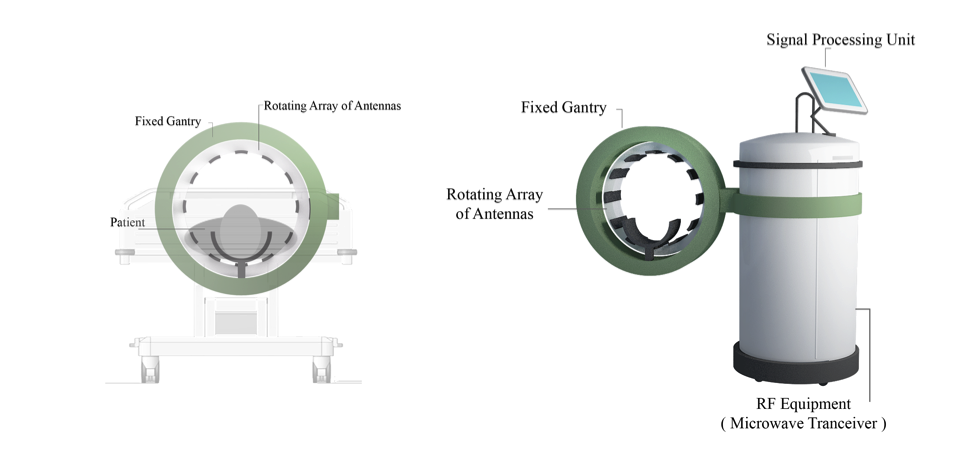
Figure 12: Representation of MIS as a Product.
In conclusion, this project showed so far the potential of the microwave radiation especially the UWB radar technique to detect the ICH stroke. This system utilizes a simple and compact antenna that operates in the range of 3.1-4 GHz. The simplicity and the small size of microwave imaging system compared to CT or MRI scanners makes it easily applicable. The major differences between the microwave imaging system and the currently used imaging modalities are that it is a low power consumption system and it is less expensive, which make it more desirable.
A system that consists of UWB antenna and a slice of a head phantom with the hemorrhagic target was constructed in CST® MWS. The aim of designing this system is to test the detection capability of the antenna. The simulation proved that the designed system was able to detect a 7.5 mm hemorrhage. Therefore, MIS is expected to be a complement tool to diagnose stroke. From the safety point of view, the amount of the EM radiation which will be exposed to the patient was taken into account.
Additionally, a 3D realistic head phantom will be fabricated to test the whole microwave imaging system in the laboratory. The simulated and fabricated phantoms will be similar in terms of permittivity and conductivity. The complete system will be hopefully constructed in reality. The image will be reconstructed by using a processing algorithm in MATLAB® software.
A very special thanks to our families for the unceasing encouragement, support and complete cooperation.
We would like to thank everyone who had contributed to the successful of this project. We want to express our special thanks of gratitude to our supervisor Dr. Ibraheem Al-Naib who gave us the golden opportunity to do this project on the field of microwave imaging. He was always keen to know what we were doing and how we were proceeding. We are grateful to our co-supervisor Eng. Sana Ijlal, for her time and valuable efforts.We would also like to thank Eng. Mohammed Al-Dahan and Dr. Fadhel Al-Molani from King Fahad Specialist Hospital, who gave us the opportunity to access lots of resources and information related to this project.
[1] V. Mohsenin, "Obstructive Sleep Apnea: A New Preventive and Therapeutic Target for Stroke: A New Kid on the Block," The American Journal of Medicine, vol. 128, pp. 811-816, 2015.
[2] J. M. Torpy, A. E. Burke, and R. M. Glass, "Hemorrhagic stroke," JAMA, vol. 303, pp. 2312-2312, 2010.
[3] L. R. Caplan, Stroke. New York, UNITED STATES: Demos Medical Publishing, 2006.
[4] T. Emiru, E. M. Bershad, N. D. Zantek, Y. H. Datta, G. H. R. Rao, E. W. Hartley, and A. A. Divani, "Intracerebral Hemorrhage," Clinical and Applied Thrombosis/Hemostasis, vol. 19, pp. 652-662, 2012.
[5] S. Buxton. (2017, Dec 14). New Ways to Act F.A.S.T. Initiatives to Speed up Diagnosis of Stroke. Available: https://www.physiospot.com/2017/11/20/new-ways-to-act-f-a-s-t-initiatives-to-speed-up-diagnosis-of-stroke/
[6] R. K. Mosewich, A. Shuaib, B. Cujec, and P. Polasek, "Impact of transesophageal echocardiogram on the management of acute stroke," Journal of Stroke and Cerebrovascular Diseases, vol. 3, pp. 57-60, ]1993.
[7] H. A. Rowley and P. Vilela, "Brain Ischemia: CT and MRI Techniques in Acute Stroke," in Diseases of the Brain, Head and Neck, Spine 2016-2019: Diagnostic Imaging, J. Hodler, R. A. Kubik-Huch, and G. K. von Schulthess, Eds., ed Cham: Springer International Publishing, 2016, pp. 37-47.
[8] M. M. Johnson, "Stroke and CT Perfusion," Radiologic Technology, vol. 83, pp. 467CT-92CT, 2012.
[9] K.-O. Lövblad, S. Altrichter, V. Mendes Pereira, M. Vargas, A. Marcos Gonzalez, S. Haller, and R. Sztajzel, "Imaging of acute stroke: CT and/or MRI," Journal of neuroradiology. Journal de neuroradiologie, vol. 42, pp. 55-64, 2015.
[10] B. J. Mohammed, "Design and Implementation of Microwave Imaging Systems for Medical Applications," Doctor of Philosophy School of Information Technology and Electrical Engineering University of Queensland, Australia, 2015.
[11] H. J. Audebert and J. B. Fiebach, "Brain Imaging in Acute Ischemic Stroke—MRI or CT?," Current Neurology and Neuroscience Reports, vol. 15, p. 6, February 10 2015.
[12] S. A. Khedr, H. M. Kassem, A. M. Hazzou, E. Awad, and M. M. Fouad, "MRI diffusion-weighted imaging in intracranial hemorrhage (ICH)," The Egyptian Journal of Radiology and Nuclear Medicine, vol. 44, pp. 625-634, 2013.
[13] M. Saritha, K. Paul Joseph, and A. T. Mathew, "Classification of MRI brain images using combined wavelet entropy based spider web plots and probabilistic neural network," Pattern Recognition Letters, vol. 34, pp. 2151-2156, 2013.
[14] C. S. Kidwell, J. A. Chalela, J. L. Saver, and et al., "Comparison of mri and ct for detection of acute intracerebral hemorrhage," JAMA, vol. 292, pp. 1823-1830, 2004.
[15] C. S. Kidwell and A. W. Hsia, "Imaging of the brain and cerebral vasculature in patients with suspected stroke: Advantages and disadvantages of CT and MRI," Current Neurology and Neuroscience Reports, vol. 6, pp. 9-16, February 01 2006.
[16] N. B. Smith and A. Webb, Introduction to Medical Imaging: Physics, Engineering and Clinical Applications. Cambridge: Cambridge University Press, 2010.
[17] S. John, S. Stock, R. Cerejo, K. Uchino, S. Winners, A. Russman, T. Masaryk, P. Rasmussen, and M. S. Hussain, "Brain imaging using mobile CT: current status and future prospects," Journal of Neuroimaging, vol. 26, pp. 5-15, 2016.
[18] K. M. Luk, "The Importance of the New Developments in Antennas for Wireless Communications," Proceedings of the IEEE, vol. 99, pp. 2082-2084, 2011.
[19] H. J. Visser, "Introduction," in Antenna Theory and Applications, ed: John Wiley & Sons, Ltd, 2012, pp. 1-13.
[20] D. Valderas, Ultrawideband antennas: design and applications: World Scientific, 2011.
[21] C. N. Paulson, J. T. Chang, C. E. Romero, J. Watson, F. J. Pearce, and N. Levin, “Ultra-wideband Radar Methods and Techniques of Mmedical Sensing and Imaging,” Proc. SPIE, vol. 6007, no. 1, p. 60070L–60070L–12, 2005.
[22] J. D. Taylor, Introduction to Ultra-Wideband Radar Systems: Taylor & Francis, 1994.
[23] X. Li, E. J. Bond, B. D. Van Veen, and S. C. Hagness, "An overview of ultra-wideband microwave imaging via space-time beamforming for early-stage breast-cancer detection," IEEE Antennas and Propagation Magazine, vol. 47, pp. 19-34, 2005.
[24] S. Y. Semenov and D. R. Corfield, "Microwave Tomography for Brain Imaging: Feasibility Assessment for Stroke Detection," International Journal of Antennas and Propagation, vol. 2008, 2008.
[25] D. I. McRee, "Environmental aspects of microwave radiation," Environmental Health Perspectives, vol. 2, pp. 41-53, 1972.
[26] R. Scapaticci, O. Bucci, I. Catapano, and L. Crocco, "Differential microwave imaging for brain stroke followup," International Journal of Antennas and Propagation, vol. 2014, 2014.
[27] M. Jalilvand, Application-Specific Broadband Antennas for Microwave Medical Imaging vol. 85: KIT Scientific Publishing, 2017.
[28] X. Zeng, Time Domain Systems for Microwave Imaging: Accuracy Evaluations and Prototype Design: Chalmers University of Technology, 2013.
[29] K. H. Sayidmarie and Y. A. Fadhel, "Design aspects of UWB printed elliptical monopole antenna with impedance matching," in Antennas and Propagation Conference (LAPC), 2012 Loughborough, 2012, pp. 1-4.
[30] C. Gabriel, "Compilation of the Dielectric Properties of Body Tissues at RF and Microwave Frequencies," KING'S COLL LONDON (UNITED KINGDOM) DEPT OF PHYSICS1996.
 Send Email